Figure 17 Statistical analysis of multi-element data from Gilberton mineral occurrences (927 samples)
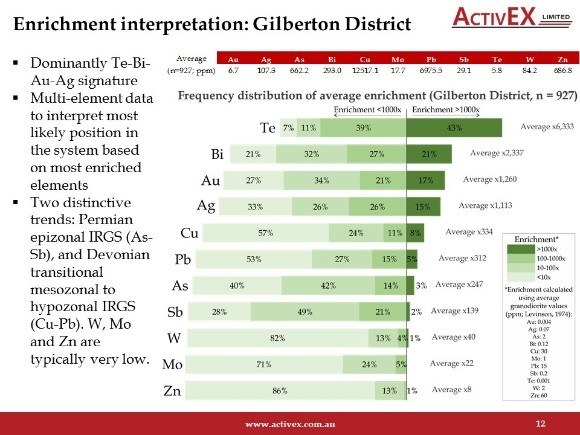
Statistical analysis of multi-element data from Gilberton mineral occurrences (927 samples). Graph shows levels of enrichment compared to average background values (Sourced from Activex Ltd)