Report Number 114062, METALLOGENIC STUDY OF THE GEORGETOWN, FORSAYTH AND GILBERTON REGIONS, NORTH QUEENSLAND is now available for download from QDEX. The authors are Dr Gregg Morrison, Harry Mustard, Ashley Cody, Dr Vladimir Lisitin (GSQ), Jose Veracruz and Dr Simon Beams.
A collaboration between Terrasearch Pty Ltd, Klondike Exploration Services and the Geological Survey of Queensland, funded under the Queensland Government Future Resources Program.
TABLE OF CONTENTS
1.0……… SUMMARY.
2.0……… INTRODUCTION.
3.0……… GEORGETOWN MINE ENDOWMENTS and HISTORICAL GOLD PRODUCTION.
4.0……… GEOLOGY.
4.1 PROTEROZOIC METAMORPHIC AND INTRUSIVE ROCKS.
4.2 SILURIAN – DEVONIAN INTRUSIVE ROCKS.
4.3 LATE DEVONIAN TO EARLY CARBONIFEROUS SEDIMENTARY ROCKS.
4.4 PERMO – CARBONIFEROUS INTRUSIVE AND EXTRUSIVE ROCKS.
5.0……… THE METALLOGENIC DATABASE AND GIS.
6.0……… AGES AND EPOCHS OF MINERALISATION.
7.0……… MINERALISATION STYLE AND DEPTH CLASSIFICATION BASED ON QUARTZ TEXTURES.
7.1 QUARTZ TEXTURES OF PLUTONIC DEPOSITS.
7.2 QUARTZ TEXTURES OF INTRUSION RELATED DEPOSITS.
7.3 QUARTZ TEXTURES OF EPITHERMAL DEPOSITS.
7.4 QUARTZ TEXTURE ASSEMBLAGES AND CAMP DEFINITION.
8.0……… MULTI-ELEMENT GEOCHEMISTRY.
8.1 METHODOLOGY OF MULTI-ELEMENT GEOCHEMISTRY INTERPRETATION.
8.2 INTERPRETATION OF GEORGETOWN MULTI-ELEMENT GEOCHEMICAL DATA.
8.3 GEOCHEMICAL ZONATION PATTERNS.
9.0 ……. DEPOSIT MODELS.
9.1 MOUNT HOGAN flat plutonic lode.
9.2 PLUTONIC LODE DEPOSITS.
9.3 GILBERTON DISTRICT.
9.5 KIDSTON INTRUSIVE RELATED MESOZONAL BRECCIA HOSTED GOLD DEPOSIT.
9.6 MOUNT TURNER.
9.7 HUONFELS, INTRUSION RELATED EPIZONAL LODE AG – AU PROSPECT.
9.8 AGATE CREEK EPITHERMAL GOLD DEPOSIT.
10.0……. OVERALL METALLOGENIC CLASSIFICATION.
11.0……. CONCEPTUAL MODEL.
12.0……. GEORGETOWN EXPLORATION POTENTIAL.
13.0……. CONCLUSIONS.
14.0……. REFERENCES.
REPORT TEXT
APPENDIX 1 : GEORGETOWN METALLOGENIC CAMP SUMMARIES
APPENDIX 2 : GEORGETOWN METALLOGENIC Database
APPENDIX 3 : GEORGETOWN METALLOGENIC CAMP STRUCTURAL PLAN
APPENDIX 4: MAPINFO WORKSPACE PACKAGE – Georgetown Metallogenic Simplified Geology (zip)
8.0 MULTI-ELEMENT GEOCHEMISTRY
Multi-element geochemical data from 203 prospects in 54 camps for the Georgetown region have been interpreted to classify the hydrothermal systems and to establish internal geochemical zoning patterns for all the main represented classes of hydrothermal deposits.
The data was sourced from the most recent geochemical database for the region held by the GSQ and derived mainly from the compilations by TerraSearch (pre-2014) and Map-to-Mine (2016). This has been augmented with company supplied confidential data from a number of major projects (Agate Creek, Gilberton, Kidston, Woolgar) and from numerous prospects with additional data or a more comprehensive suite of elements. The interpretation of this data is supplied as part of the project, but the raw data is not.
In this project rock chip and drill-hole data have been used in preference to soil and stream data to establish true templates of the hydrothermal systems and zoning models without the complexities of differential transport of elements by surficial processes. Diagnostic metal associations and zoning patterns can be recognised in residual soils and the stream sediments can be useful guides to system location using pathfinder elements. Some of the case histories presented here include interpretation of this data.
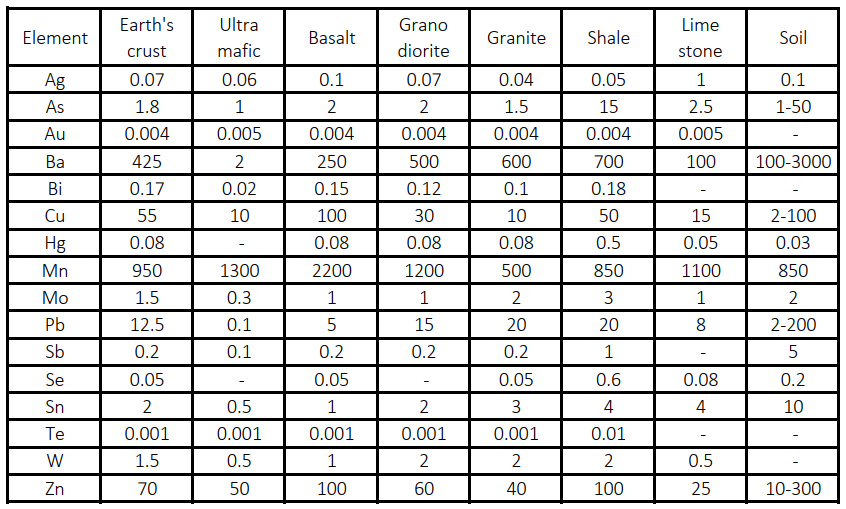
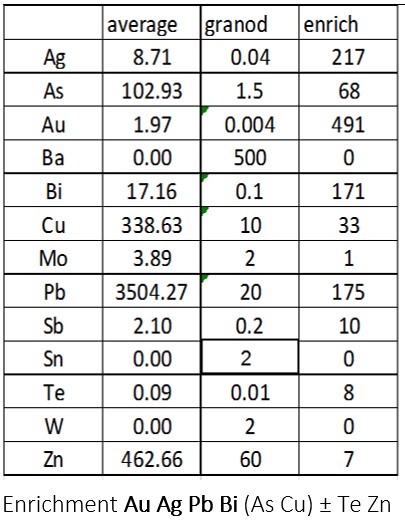
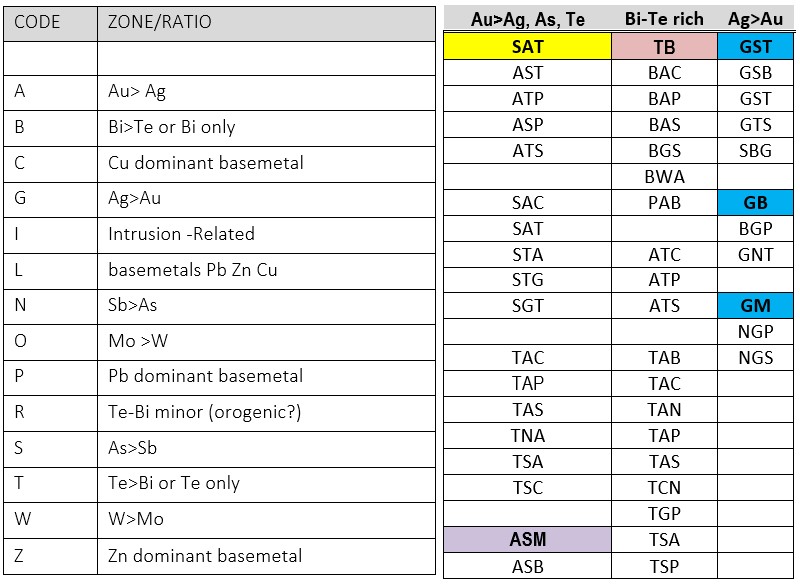
While much of the modern data analysed using ICP methods include up to 51 elements that can be used for rock type and alteration classification, the suite used here is for the metallic elements that are commonly concentrated in magmatic-hydrothermal systems. The overall classification scheme is based on a 12-element suite (Au-Ag, As-Sb, Cu-Pb-Zn, Bi-Te, Mo-W-Sn ± Ba, Hg, Mn and Se) that has proven useful for both deposit classification and geochemical zoning. The classification is determined from the relative enrichment of the elements, estimated as the average element concentration in a sample suite divided by the corresponding average concentration values for the dominant host rock (Tables 8.1 & 8.2). The elements are then listed in the order of relative enrichment and tabulated for comparison with the existing general classification scheme for north Queensland (Tables 8.3, 8.4 & 8.5) which tags the major hydrothermal system classes and alteration zones by geochemical association and inferred spatial proximity to a causative intrusion.
8.2 INTERPRETATION OF GEORGETOWN MULTI-ELEMENT GEOCHEMICAL DATA
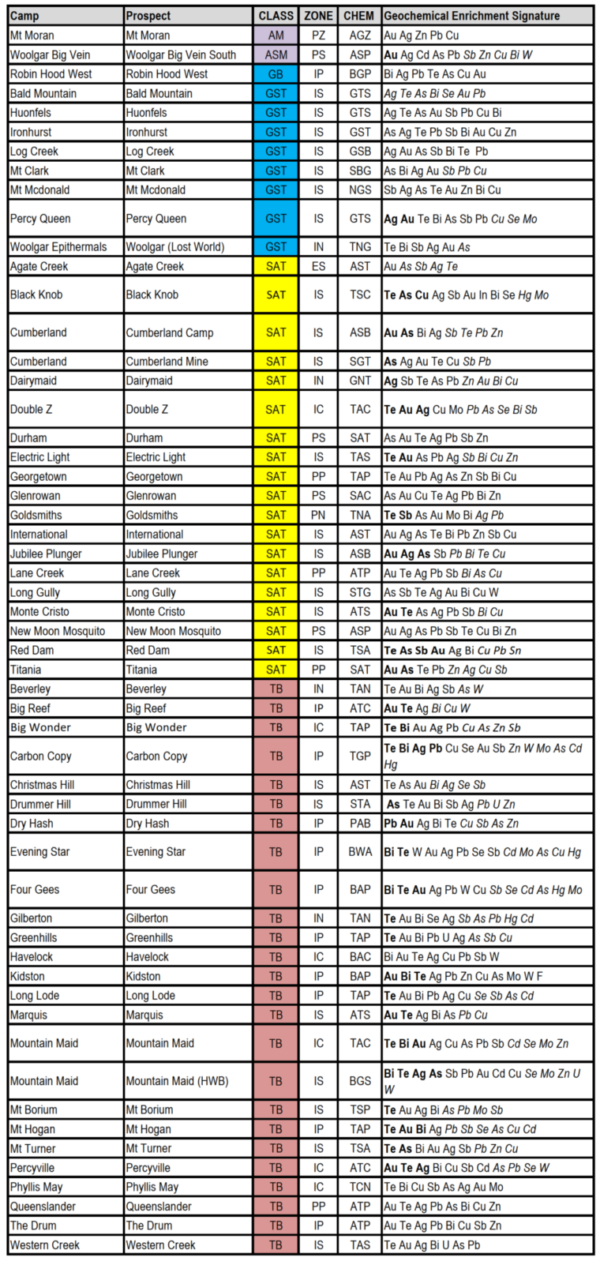
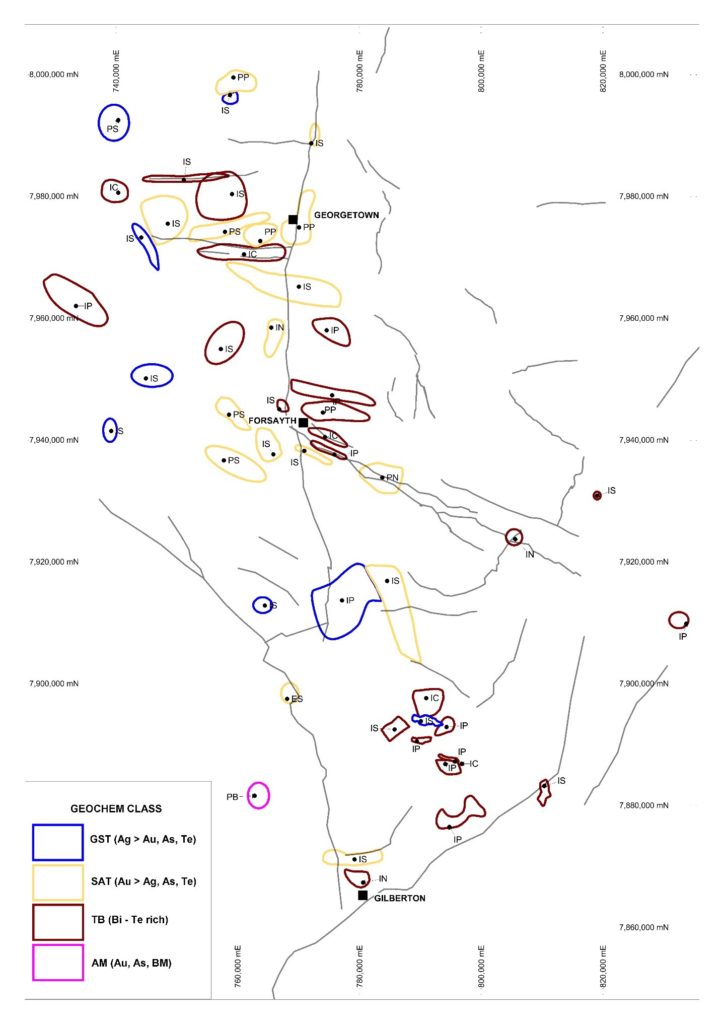
The multi-element data interpretation for 56 systems has been tabulated (Table 8.3) and a classification scheme built on the element class has been established (Table 8.4). The aim was to distinguish the different genetic clans of mineralisation and establish the level of current exposure in the zoned systems.
In the Georgetown region, the main interest is in the geochemical distinction between what have been called Early Devonian granite-hosted plutonic lodes like those in Georgetown and Forsayth districts; the early Carboniferous IRGS like Kidston; the early Permian IRGS systems like Phyllis May; and the early Permian epithermal systems like Agate Creek.
The geochemical classification scheme was built from the enrichment suite by designating some key element ratios (Table 8.4). In the code list the Au/Ag ratio, the Bi/Te ratio and the position of As-Sb versus Pb-Zn-Cu are mainly diagnostic of the system type, whereas the relative position in the enrichment table of As Sb Cu Pb Zn Mo W are indicative of the level (metal zone) in the system.
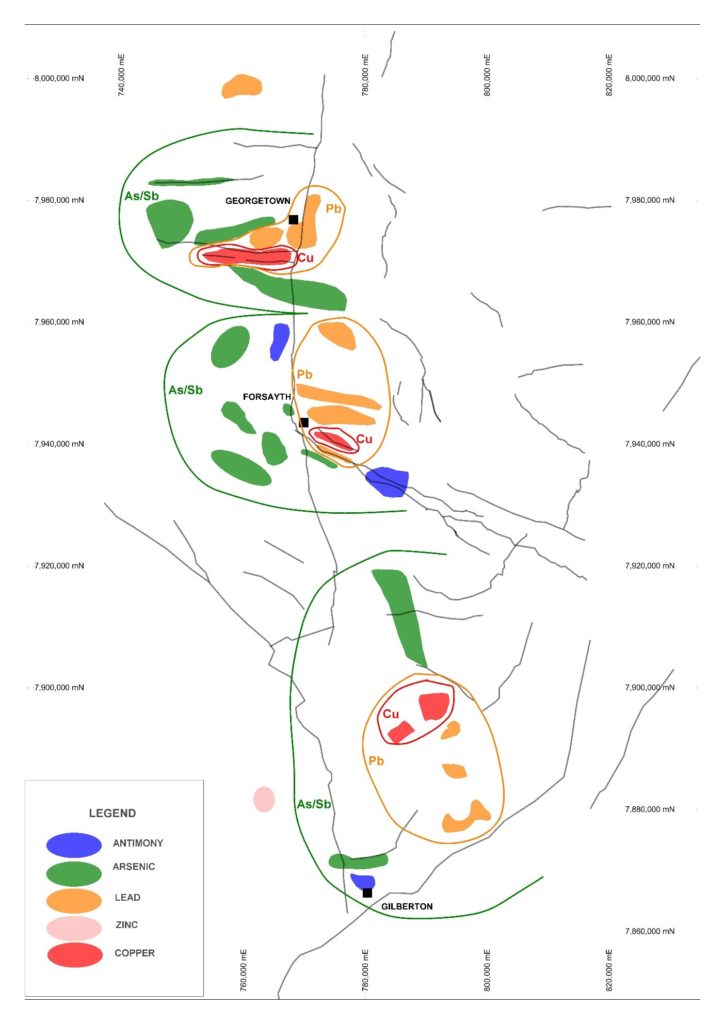
High Te and Bi are key indicators of magmatic-hydrothermal systems overall and also vary systematically, with Te dominant in mafic systems and Bi dominant in felsic systems. The Bi/Te ratio thus progressively increases going from mafic to felsic intrusion-related systems (Table 8.5). Plutonic and Epithermal systems have much lower or absent Bi and Te so they are mid-range or weak in the enrichment list. As-Sb are more consistently high in the enrichment list than base metals for plutonic and epithermal systems whereas base metals are more prominent in IRGS.
The CHEM classification (Table 8.3) is determined by listing the three dominant elements from the enrichment suite. The level in the system or ZONE (Table 8.3) is labelled using the style of mineralisation (Plutonic = P, IRGS = I, Epithermal = E) and a code representing the important metal ratios from Table 8.4. The CLASS code is a generalisation of the CHEM codes based on Au – Ag ratios and Te-Bi levels (Table 8.3 & 8.4).
The classes within the IRGS clan relate to level of emplacement and/or the composition of the related intrusion, so there is a distinction of Bi-rich felsic intrusive systems from Te-rich mafic intrusive systems, and those more enriched in As-Sb compared with base metals in the plutonic IRGS group (Table 8.5).
8.3 GEOCHEMICAL ZONATION PATTERNS
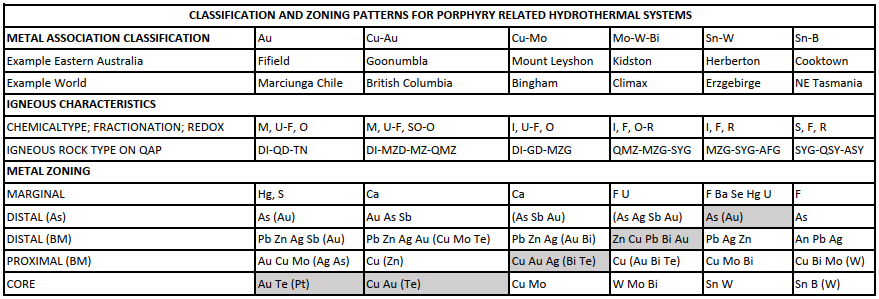
The geochemical zoning template (Table 8.5) was constructed during a major project on eastern Australia Intrusion-Related Mineral Systems (IRMS) undertaken by Gregg Morrison and Phil Blevin in 1994-1997 as AMIRA Project P425. The template identifies variations in metal zoning patterns for IRMS emplaced mainly at the porphyry level and related to intrusions of different magmatic geochemistry and evolution. It is based on more than one hundred examples from north Queensland which were then compared with international examples considered typical of the magma chemistry spectrum. A feature of Table 8.5 is the consistent overall pattern of metal zones that allows the classification to include five standard metal zones that can be used in place of the local metal suite. The table also allows the subtle differences between system types to be identified with key elements and element assemblages. For example, the position of maximum gold concentration in relation to a causative intrusion varies systematically from nearest to the intrusion (the core) in mafic systems to progressively more distal in felsic systems. This is shown by the shading in Table 8.5 and illustrated by Figure 11. In addition, Bi and Te that are demonstrated consistently as key indicators of magmatic-hydrothermal systems also vary systematically, with Te dominant in mafic systems and Bi dominant in felsic systems. The Bi/Te ratio thus progressively increases going from mafic to felsic systems.
In the Georgetown region, the majority of IRMS fall in one of three groups characterised by Cu-Au, Cu-Mo or Mo-W-Bi metal association in the core element zone (Table 8.3). However, almost all of them have been targeted for gold, rather than base metals as the economic commodity, so they fall into the more specific category of intrusion related gold systems (IRGS). This makes the zoning models valuable because the Au-rich part of the systems may not be exposed at surface, which, if misunderstood could have discouraged historical gold exploration. As a consequence, our metallogenic work has targeted identification of IRMS systems and the geochemical data search has tried to classify and develop zoning models for these systems, so they can be ranked in terms of likely position of the best gold in relation to current surface exposures.


